Selain bisa men_define_ target secara static, Prometheus juga mendukung konfigurasi secara dynamically menggunakan service discovery. Salah satunya Prometheus dapat melakukan query ke Nova API untuk me-list seluruh Instances di OpenStack sebagai target untuk dimonitoring.
Kebutuhan: – Prometheus – Grafana – Node Exporter – OpenStack RC / Credential
Langkah-langkah:
I. Prometheus Server
- Update server dan pasang paket pendukung
yum -y update
yum -y install vim- Unduh Prometheus Server
curl -LO "https://github.com/prometheus/prometheus/releases/download/v2.5.0/prometheus-2.5.0.linux-amd64.tar.gz"
tar xvfz nxvfz prometheus-2.5.0.linux-amd64.tar.gz -C /opt/ && mv prometheus-2.5.0.linux-amd64 prometheus-server
cd /opt/prometheus-server/- Sunting berkas konfigurasi, sesuaikan konfigurasi yang diinginkan
vim config.yml

# my global config

global:
  scrape_interval:     15s # Set the scrape interval to every 15 seconds. Default is every 1 minute.
  evaluation_interval: 15s # Evaluate rules every 15 seconds. The default is every 1 minute.
  # scrape_timeout is set to the global default (10s).

# Alertmanager configuration
alerting:
  alertmanagers:
  - static_configs:
    - targets:
      # - alertmanager:9093

# Load rules once and periodically evaluate them according to the global 'evaluation_interval'.
rule_files:
  # - "first_rules.yml"
  # - "second_rules.yml"

# A scrape configuration containing exactly one endpoint to scrape:
# Here it's Prometheus itself.
scrape_configs:
  # The job name is added as a label `job=` to any timeseries scraped from this config.
  - job_name: 'prometheus'
    static_configs:
    - targets: ['localhost:9090']
  - job_name: 'openstack-sd'
    openstack_sd_configs:
      - identity_endpoint: https://url-keystone-server:443/v3
        username:
        project_id:
        password:
        role:
        region:
        domain_name:
port: 9100- Verifikasi berkas config Prometheus server pastikan SUCCESS
./promtool check config config.yml- Jalankan Prometheus server sebagai service
vim /etc/systemd/system/prometheus-server.service

[Unit]
Description=Prometheus Server

[Service]
User=root
ExecStart=/opt/prometheus-server/prometheus --config.file=/opt/prometheus-server/config.yml --web.external-url=http://ip-server:9090/

[Install]
WantedBy=default.target- Jalankan service Prometheus Server
systemctl daemon-reload
systemctl enable prometheus-server.service
systemctl start prometheus-server.service- Verifikasi bahwa service Prometheus sudah berjalan
systemctl status prometheus-server.service
ss -tulpn |grep 9090
II. Grafana
- Pasang Grafana
yum -y install https://s3-us-west-2.amazonaws.com/grafana-releases/release/grafana-5.1.4-1.x86_64.rpm
/sbin/chkconfig --add grafana-server- Jalankan service Grafana
systemctl enable grafana-server.service
systemctl start grafana-server.service
systemctl status grafana-server.service- Akses Grafana Dashboard http://ip-server:3000 `
– Login dengan usename dan passsword admin/admin
– Klik ‘Add Datasource’
– Name: Prometheus, Type: Prometheus
– Http settings: http://localhost:9090
– Klik ‘Save and Test’.
Pastikan hasilnya ‘success’ dan ‘datasource added’
`
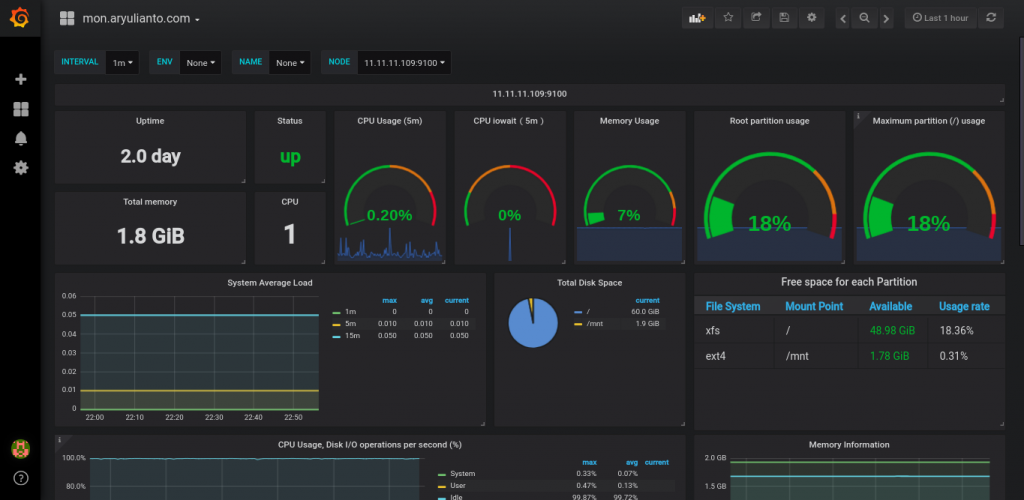
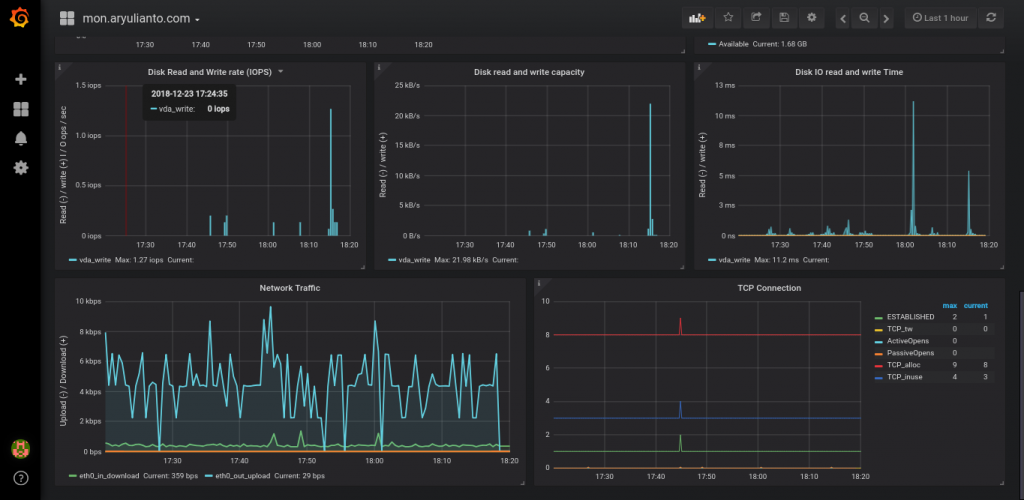
- Buat dashboard atau bisa juga unduh di https://grafana.com/dashboards sesuai dengan kebutuhan anda, sebagai contoh:
III. Node Exporter
- Pasang Node Exporter ditiap Instance yang ingin anda monitoring
#!/bin/bash

sudo -i
curl -LO "https://github.com/prometheus/node_exporter/releases/download/v0.17.0/node_exporter-0.17.0.linux-amd64.tar.gz"
tar xvfz node_exporter-0.17.0.linux-amd64.tar.gz -C /opt/

cat << EOF >/etc/systemd/system/node_exporter.service
[Unit]
Description=Node Exporter

[Service]
User=root
ExecStart=/opt/node_exporter-0.17.0.linux-amd64/node_exporter

[Install]
WantedBy=default.target
EOF

systemctl daemon-reload
systemctl enable node_exporter.service
systemctl start node_exporter.service
systemctl status node_exporter.service
rm -rf node_exporter-0.17.0.linux-amd64.tar.gz
Sekarang saat ada Instances baru anda hanya perlu memasang atau menambahkan Node Exporter (bisa juga dipasang waktu create Instance di Customization Script) dan secara otomatis Prometheus server akan men-scrapenya dan viola! seluruh Instances bisa dimonitoring di dashboard Grafana sekarang 😀
Referensi: https://medium.com/@pasquier.simon/monitoring-your-openstack-instances-with-prometheus-a7ff4324db6c